


Executive Summary
NPS is a widely used measurement tool for customer loyalty. The popularity of NPS is evident from its use among e.g. Fortune 1000 companies. NPS has evolved over time, which means there are variations of NPS. One of them is the eNPS, which measures employee engagement within an organization through a question about how likely it is that they would recommend their company as a workplace to a friend. Based on what the employee scores, the employee is either an ambassador, passive or critic. Ambassadors are committed to their company while passives are not fully satisfied and more likely to leave and detractors are the worst critic of the company.
That eNPS is a simple measurement has both strengths and weaknesses, which is discussed in relation to its origin from NPS. As more and more organizations utilize NPS and eNPS there is an opportunity to see and compare the results. Examining companies in various industries that use NPS and eNPS shows the widespread use of these methods. However, there are several options for measuring employee commitment and loyalty to their workplace. This white paper explores three such options, each of which has similar characteristics to eNPS in having a numerical score that shows either employee satisfaction, employee engagement, or job satisfaction. The options discussed are Employee Satisfaction Index (ESI), Employee Engagement Score and Job Descriptive Index (JDI). The three options are presented with detailed explanations, illustrative examples and a discussion of their advantages and disadvantages.
Four Key Takeaways
- NPS and Adaptations
It is an advantage how NPS is seen as a standardized metric for customer loyalty, and widely used by Fortune 1000. Adaptations like bNPS, rNPS, and pNPS offer tailored insights into areas such as brand perception and product satisfaction. However, NPS oversimplifies complex customer satisfaction issues and lacks detailed insights into underlying factors.
- eNPS
A strength for eNPS is its straightforward method for gauging employee engagement and loyalty. Therefore, it is also used as a simple and practical comparability number across industries with a standardized metric for benchmarking and tracking changes over time. However, in its similarity with NPS, eNPS may oversimplify complex workplace issues and fail to provide detailed insight into the root causes of employee satisfaction or dissatisfaction.
- Exploring Alternatives to eNPS
There are several options to eNPS out there for example ESI, Employee Engagement Score, and JDI, which offer nuanced approaches to measuring satisfaction and engagement with employees. They arguably also provide deeper insights into specific aspects of the workplace that eNPS does not. However, they achieve that through more extensive surveys which can cause potential respondent fatigue. Followed by these methods lacking the simplicity and easy comparability of eNPS.
- Implementation Considerations
It has been highlighted how careful implementation and interpretation of eNPS, and alternative metrics are essential for deriving meaningful insights. Properly executed, these metrics can inform strategic decision-making and drive improvements in employee satisfaction. Without proper implementation and interpretation, there’s a risk of misinterpretation, manipulation, or oversimplification of complex issues, leading to ineffective use of these metrics in driving organizational improvements.
1. NPS and Its Adaptations
In 2003, the Net Promoter Score (NPS) was introduced by Frederick Reichheld in the Harvard Business Review Article “The one number you need to grow” (Vélez, Ayuso, Perales-González & Rodríguez, 2020). Today it is used by two-thirds of the Fortune 1000 (Reichheld, Darnell & Burns, 2021). NPS is a customer-relationship management system of gauging customer satisfaction and customer loyalty in real time and is based on one simple question:
“How likely is it that you would recommend [company X] to a friend or colleague?” (Reichheld, 2003, p.50).
This question is rooted on measuring customer loyalty, since customers risk their own reputation based on the recommendations they make to their friends (Baehre, O’Dwyer, O’Malley, & Lee, 2022).
The respondents answer the question on a scale of 0 to 10 and based on their answer are later grouped into three customer categories. The customer categories are:
- “Promoters”: Customers who give the highest scores of 9 or 10 fall into this category. They are highly satisfied and loyal customers who are likely to promote the company to others (Reichheld, Darnell, & Burns, 2021).
- “Passives”: These are customers who respond with a score of 7 or 8. They are moderately satisfied customers who may or may not actively promote the company (Reichheld et al., 2021).
- “Detractors”: Customers who provide a score between 0 to 6 are considered detractors. They are dissatisfied customers who may potentially harm the company’s reputation and growth (Reichheld et al., 2021).
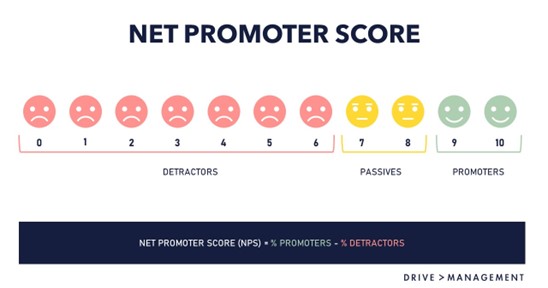
Figure 1: Net Promoter Score calculation image by Drive Management
As seen in Figure 1, the NPS is later calculated by subtracting the percentage of the customers who are detractors from the percentage who are promoters (Reichheld et al., 2021). The resulting score ranges from -100 to +100 where a higher score indicates a stronger and positive customer loyalty, while a lower score suggests areas for improvement (Grisaffe, 2007).
NPS is widely used by businesses as a simple and effective way to assess customer satisfaction, track changes over time, and identify areas for improvement to enhance the overall customer experience (Reichheld, 2011). However, NPS is a powerful methodology and has been adapted to not only measure customer loyalty (Jankiraman, 2021). Therefore, there is only one standardized version of NPS but there are adaptations and applications of NPS in other specific contexts (Khandelwal, 2023).
A few adaptations of NPS in specific contexts are:
- Brand NPS (bNPS): bNPS measures the loyalty and advocacy of customers specifically towards a brand (Jankiraman, 2021). It helps organizations understand how well their brand is perceived and how likely customers are to recommend it to others (Jankiraman, 2021). This variant of NPS focuses on the brand rather than a specific product or service (Jankiraman, 2021).
- Relationship NPS (rNPS): rNPS assesses customer loyalty and advocacy towards an ongoing relationship with a company (Khandelwal, 2023). It provides insights into the overall customer experience and the likelihood of customers continuing to do business with the organization over time (Khandelwal, 2023).
- Product NPS (pNPS): pNPS focuses on measuring customer loyalty and advocacy towards a particular product or service offered by a company (Jankiraman, 2021). It helps organizations assess customer satisfaction with specific offerings and identify areas for product improvement (Jankiraman, 2021).
However, we will specifically dive into another adaptation of NPS which is called the Employee Net Promoter Score (eNPS).
2. eNPS: Components and Applications
The Employee Net Promoter Score (eNPS) is an employee adaptation of the NPS question. Therefore, eNPS uses the same NPS scale and methodology, but the question is directed towards employees and asks how likely they are to recommend their company as a place to work to friend (Khandelwal, 2023). There are more and more organizations focusing on eNPS (Yaneva, 2018). The use of eNPS does not only promote the company as an employer but also the products or services of the company they are engaged in (Yaneva, 2018). Therefore, eNPS is a measurement of employee engagement within an organization (McPherson, 2017; Yaneva, 2018).
Within eNPS the three categories of employees are still promotors, passives, and detractors. However, promoters are the employees who are loyal enthusiasts, committed to their company and encourage their friends to follow suite (Yaneva, 2018). They are more productive, stay with the company for longer, avoid mistakes and are less likely to steal from their company (Yaneva, 2018). The promoters have their work needs met by the company, therefore causing them to advocate and potentially influence others to work for the same company as well (Yaneva, 2018).
The passive employees are not as satisfied by their company and therefore more likely to join the competitors (Yaneva, 2018). They are seen as a company’s greatest uncertainty since they may be productive at work but not feel loyal to their company (Yaneva, 2018). Their work needs are not fully met, and they are therefore more likely to miss workdays or leave the company (Yaneva, 2018).
In the detractor category are the employees that can be the worst critic of the company and influence current or potential employees to agree with their sentiment, through insisting on sharing their dissatisfaction of the company with others (Yaneva, 2018). The detractors are usually unhappy employees who feel trapped to the job based on circumstances, such as convenience, lack of alternatives and so on (Yaneva, 2018). They may be physically at work, but they are mentally elsewhere due to most of their work needs not being met (Yaneva, 2018).
Like NPS, the eNPS score can range from -100 to +100 and company scores can vary from industry and company size (Smith, 2022). If a company eNPS is in the negatives it is an indication for bigger underlying issues for the score that should be addressed (Smith, 2022). However, its most common for companies to have an eNPS between 0 to 30, making anything over a 40 an excellent eNPS score (Smith, 2022).
3. Advantages and disadvantages of using NPS and eNPS
Since the eNPS is derived from the NPS methodology, it is plausible to do an analysis on their pros and cons together. The methodology is a simple way of measuring satisfaction and loyalty, and it has been analysed by industry experts who have differing opinions of the measuring systems advantages and disadvantages (Staff Reports, 2010). Its simplicity is being highlighted as an advantage, since it is a one number score and an easy-to understand formula which can be adapted and understood regardless of the business industry or one’s position in the company (Staff Reports, 2010). Therefore, eNPS’s simplicity results in no need for special instruction, which makes it easily understood by respondents and management and a practical tool to measure a general opinion (Sedlak, 2020).
Furthermore, Reichheld (2011) states that the NPS is a simple and practical indicator of what customers think, which every company can adapt for free to add insight and transparency, as well as it being easy to understand and improve. However, whitepapers and academic articles have claimed how the NPS does not work (Reichheld, 2011). Critics argue that it is too simple and cannot identify problems or offer any solutions as well as not grasp the personal and relational elements of customer satisfaction (Staff Reports, 2010). Followed by the related argument that the eNPS single-item measure does provide information on whether the employees are satisfied or not, but no further information on the reasons of their answers (Sedlak, 2020). Thereby, the eNPS does not provide help to improve a situation since it does not specifically mention the root cause of satisfaction or dissatisfaction (Sedlak, 2020). Although, Reichheld (2011) advocates for the NPS being priceless and provides help with running a business. Additionally, the simple metric offers comparison element which allows the score to be measured up against other firms (Staff Reports, 2010), also known as benchmarking. However, an issue claimed to be the biggest disadvantage of the eNPS occurs when it is used by people who do not know how the score is calculated, which may cause the score to be below 0 in cases when most of the people chose, for example, 7 and 8 on the 0 to 10 scale (Sedlak, 2020). Resulting in an incorrect and faulty eNPS which may hinder an accurate company comparison.
Focusing exclusively on NPS, Reichheld (et al., 2021) has argued how its credibility has been diminished. Methods contributing to this decline include pleading, bribery, and manipulation, as well as a lack of disclosure regarding surveyed individuals, sample sizes, response rates, and the triggering of surveys by specific transactions (Reichheld et al., 2021). Nevertheless, companies with high NPS scores demonstrate sustainable revenue growth through repeat business and referrals (Reichheld et al., 2021). Therefore, it is contended that attempting to manipulate NPS scores can result in costly errors in the pursuit of customer loyalty (Colvin, 2020).
Shifting focus on how this impacts eNPS, it is stated how falsifying ones eNPS could hinder an opportunity for true insight into the company’s employee satisfaction, possibly obstructing solutions for an improvement. Additionally, it is not recommended to hide the eNPS score from the employees since transparency can cause the employees to feel included and invested as well as show that the company is committed to improving the results (Leapsome Team, 2023). Smith highlights how eNPS is seen as a tool to measure quick data and then possibly be able to laser focus on needed solutions before the problems fester and grow (Smith, 2022). Therefore, obstructing or manipulating ones eNPS possibly diminishes this opportunity.
4. The NPS and eNPS of Top Companies
Any business leader will know that it is crucial to keep customers and employees happy, which is where the use of NPS and eNPS comes in (YEC, 2023). Ever since the first article in 2003, Reichheld have released a 2.0 and 3.0 version of the widely used NPS (Reichheld, Darnell, & Burns, 2021). The authors states that:
“Since then, NPS has spread rapidly around the world. It has become the predominant customer success framework—used today by two-thirds of the Fortune 1000” (Reichheld et al., 2021, p.2).
Comparatively, companies use both NPS and its variant eNPS to measure customer and employee satisfaction (YEC, 2023). In the table below are examples of perhaps well-known companies with some even being Fortune 500, within different industries who use NPS and eNPS. The table is compiled of data found by Goodey (2022), Le Bras (n.d.) and statistics found on comparably.com from the date of June 2023. An PDF link of the top 100 companies NPS scores can be found in Appendix 1: The companies 2023 NPS and a complete table of the NPS scores can be found in Appendix 2: The companies 2022 eNPS.
| Company | Industry | 2023 NPS | 2022 eNPS |
| Consumer Brands / Internet | 58 | 37 | |
| Netflix | Consumer Brands / Entertainment | 67 | 36 |
| Apple | Consumer Brands / Electronics | 61 | 19 |
| Amazon | Consumer Brands / Internet | 73 | 15 |
| Nike | Apparel | 50 | 25 |
| Spotify | Entertainment | 53 | 15 |
| McDonald’s | Consumer Brands / Fast Food | 23 | -14 |
| Samsung | Consumer Brands / Electronics | 21 | 18 |
Table 1: 2023 NPS & 2022 eNPS of companies
5. Exploring Alternatives to eNPS
The alternatives to eNPS we have decided to include have similar qualities to eNPS by being a numeric score which show either employee satisfaction, employee engagement or job satisfaction.
5.1 Employee Satisfaction Index (ESI)
The Employee Satisfaction Index (ESI) is a survey which measures how satisfised employees are with their job (Paulyne, 2022). ESI is similar to eNPS with using a metric number that can be used to compare over time and through benchmarking (Netigate Marketing, 2014). However, ESI is based on three questions, whilst eNPS is based on one question (Smith, n.d.).
It is stated that these three questions are:
- How satisfied are you with your current workplace?
- How well does your current workplace meet your expectations?
- How close is your current workplace to the ideal one? (Paulyne, 2022; Smith, n.d.).
Employees are answering these questions on a scale from 1 to 10, where 1 is the lowest and 10 is the highest (Netigate Marketing, 2014). After the results are collected, the following formula is used to calculate the ESI score:
ESI= [((question mean value ÷ 3) – 1) ÷9] *100 (Netigate Marketing, 2014; Paulyne, 2022).
The ESI result can range from 0 to 100, where a higher score or index is an indicator of more satisfied employees (Netigate Marketing, 2014; Smith, n.d.). An ESI below 50 is very low and 50-61 low, whilst a score between 62-69 is acceptable, anything between 70-80 is high and over 80 is very high (Employee Satisfaction Index – ESI Survey, n.d.)
It is argued that ESI is a great first step to analyze the current satisfaction level in a company (Paulyne, 2022). Because of its simple three questions it is deemed easier to break down and calculate for ones ESI value (Netigate Marketing, 2014). In comparison with eNPS which focuses loyalty and revolves around one question, ESI has three questions and measures more full-scale with more in-depth questions (Netigate Marketing, 2014). However, it is highlighted how critical it is to combine ESI with other tools to get a more detailed answer (Paulyne, 2022) since ESI is built on just three questions (Netigate Marketing, 2014).
5.2 Employee Engagement Score
A second alternative to eNPS is the Employee Engagement Score which measures employees’ level of engagement, motivation, and commitment to their job (Ramirez, 2023). The Employee Engagement Score is a numerical value derived from asking employees a set of questions surrounding employee engagement (Ganesh, 2023). The questions should be curated based on the company’s goals, values, and culture (Ramirez, 2023). The responses are typically collected through a survey or questionnaire format and assess different dimensions of engagement such as job satisfaction, organizational commitment, career growth, workload, sense of belonging, and motivation (Ganesh, 2023; Ramirez, 2023).
Most commonly, the results from the survey are on a Likert scale where each question would have five response options which results in a 1 to 5-point system (Ramirez, 2023). The higher scores showcase higher levels of Employee Engagement (Ganesh, 2023). When calculating the Engagement Score per employee one adds the points and divided the total with the number of questions asked (Ramirez, 2023). A low Employee Engagement Score would be 0-29%, a neutral score is 30-69% whilst a high engagement score is 70-100% (Ramirez, 2023).
Below is a sample of an Employee Engagement Score which showcases the example of two dimensions, Job Satisfaction and Organizational Support. In each dimension, the questions asked to the employees are shown, as well as the scores of the dimensions and individual questions.
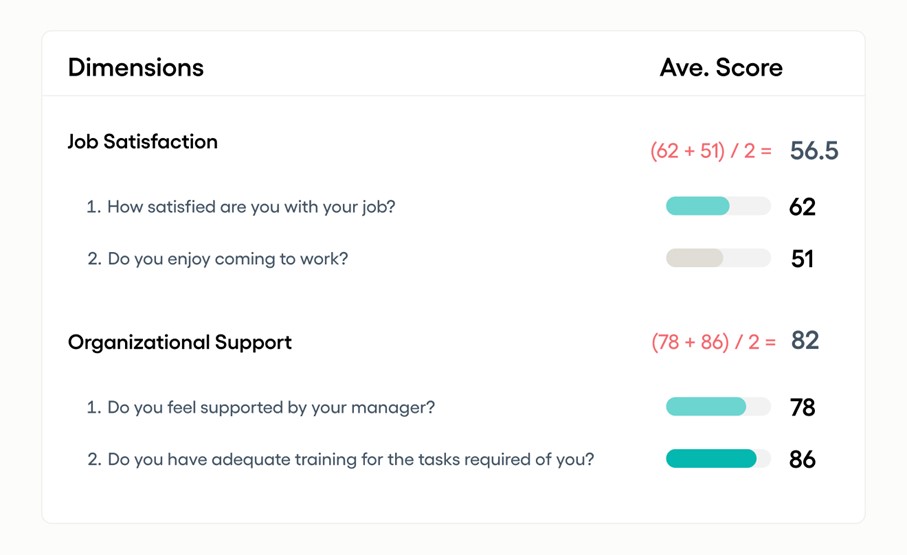
Figure 2: Sample of Employee Engagement Score (Ramirez, 2023).
The author Ramirez (2023) mentioned how it’s important to design a survey which is clear, easy to understand and curated to one’s company. Furthermore, the purpose behind measuring the score is to be able to identify areas of improvement with employee engagement and satisfaction (Ramirez, 2023). However, it is recommended that you combine the employee engagement score with other contextual factors to gain a comprehensive understanding of the underlying drivers of engagement (Ganesh, 2023; Ramirez, 2023).
5.3 Job Descriptive Index (JDI)
When it comes to a third alternative to eNPS, there is the Job Descriptive Index (JDI) which measures job satisfaction. Numerous studies and theories have aimed to uncover the positive or negative aspects of employees’ work experiences (Tutuncu & Kozak, 2007). One of the methods of investigating this is through the previously mentioned JDI which was introduced by Smith, Kendall, and Hulin in 1969 and it is the most widely used analytical tool to measuring job satisfaction (Spector, 1997). The JDI includes five categories, more commonly referred to as facets, covering aspects like job details, salary, promotion opportunities, interactions with colleagues, and supervision (Spector, 1997).
Over the past 50 years the JDI Research Group have developed scales that complement the original JDI (Lake, Gopalkrishnan, Sliter & Withrow, 2010). Thus, the JDI was updated by the JDI Research Group three times, first in 1985, second in 1997 and third in 2009 (Castanheira, 2014). The aim with the first update of the JDI was to add a scale that measures overall satisfaction through Job in General Index (JIG) (Kinicki, McKee-Ryan, & Schriesheim, 2002). The JIG consists of 18 words and was establish as complementary to the JDI (Tasios & Giannouli, 2017).
The JDI Research Group has not only created satisfaction scales but has also devised measurements for other significant work-related concepts (Lake et al., 2010). For instance, the Stress in General (SIG) scale assesses job-related stress, and they also have a Trust in Management (TIM) scale (Lake et al., 2010; Job Descriptive Index, n.d.). As mentioned, the JDI and JIG had previously undergone a norming process (Lake et al., 2010) whereas the SIG and TIM are currently undergoing their first norming procedures (Lake et al., 2010; Job Descriptive Index, n.d.).
The complete scale of the JDI comprises 72 items where each facet consisting of either 9 or 18 items (Spector, 1997). All items consist of concise words or phrases designed to describe the job e.g., “low” for work satisfaction, “lazy” for supervision satisfaction (Kinicki et al., 2002; Spector, 1997). Respondents are instructed to mark a “Y” next to an item if it accurately describes the specific aspect of the job, an “N” if it does not, and a “?” if they are uncertain or cannot decide (Kinicki et al., 2002). These responses are scored 3, 1, and 0 respectively (Tutuncu & Kozak, 2007). For every facet scale, a concise clarification precedes the items related to that particular facet. Both favourable, positively worded, and unfavourable, negatively worded items are included (Spector, 1997).
To summarize, the JDI contains 72 items grouped into five groups, whilst the JIG consists of 18 items which create one group, making the revised version of JDI 90 items and six groups (Tasios & Giannouli, 2017). An example of a revised JDI from Bowling Green State University is illustrated below, but due to their request, only three items per facet will be included. The JDI scoring system is available in the user manual (Kiefer, Harris-Kojetin, Brannon, Barry, Vasey & Lepore, 2005)
| Think of the work you do at present. How well does each of the following words or phrases describe your work? In the blank beside each word or phrase below, write: Y for “Yes” if it describes your work N for “No” if it does not describe it ? for “?” if you cannot decide |
| Work on Present Job __ Fascinating __ Routine __ Satisfying People on Your Present Job __ Stimulating __ Boring __ Slow Pay __ Bad __ Comfortable __ Less than I deserve Opportunities for Promotion __ Good opportunities for promotion __ Opportunities somewhat limited __ Promotion on ability Supervision __ Supportive __ Hard to please __ Impolite Job in General __ Pleasant __Bad __Great |
Table 2: Sample of The Job Descriptive Index © Bowling Green State University, 1975-2009 (Job Descriptive Index, n.d.)
The JDI is a described to be a user-friendly method of measuring job satisfaction since respondents chooses from three response options: “Yes”, “Uncertain”, or “No” (Tutuncu & Kozak, 2007). However, the concept of job satisfaction is considerably more intricate because it directly ties to personal experiences (Tutuncu & Kozak, 2007). Some researchers argue that job satisfaction stems from a mix of employee expectations, aspirations, current circumstances, and complex attitudes toward work (Clark & Oswald, 1996; Hamermesh, 2001). This suggests that job satisfaction can vary depending on working conditions, demographics, career expectations, and job characteristics (Tutuncu & Kozak, 2007). Research shows that employees can be content with certain job aspects while dissatisfied with other aspects (Qu & Tse, 1996). Therefore, based on these arguments, job satisfaction is a composite of multiple factors within one’s workplace (Tutuncu & Kozak, 2007).
It is argued that one of JDI’s biggest limitations is that it is limited to five facets, even though these encompass some of the most frequently assessed aspects (Spector, 1997). Moreover, there is a related concern regarding the JDI pertains to its length (Kinicki et al., 2002). Whilst the eNPS is one question, the JDI necessitates a five-page questionnaire, featuring a substantial number of items (72) in comparison to its relatively small number of facets (five) (Kinicki et al., 2002). Also, there has been criticism suggesting that some items may not apply to all employee demographics (Buffum & Konick, 1982; Cook et al., 1981). However, The JDI has remained as one of most widely used tool to measure job satisfaction (Spector, 1997), which is argued to be due to its resilient emphasis on psychometric rigor and frequent updates throughout the years (Lake et al., 2010). It is also worth noting that this criticism applies to most job satisfaction scales (Spector, 1997).
References
Baehre, S., O’Dwyer, M., O’Malley, L., & Lee, N. (2022). The use of Net Promoter Score (NPS) to predict sales growth: insights from an empirical investigation. Journal of the Academy of Marketing Science, 50(1), 67–84. https://doi.org/10.1007/s11747-021-00790-2
Castanheira, F. (2014). Job Descriptive Index. In Encyclopedia of Quality of Life and Well-Being Research (pp. 3439–3441). Springer Netherlands.
Clark, A., Oswald, A., & Warr, P. (1996). Is job satisfaction U-shaped in age? Journal of Occupational and Organizational Psychology, 69(1), 57–81. https://doi.org/10.1111/j.2044-8325.1996.tb00600.x
Colvin, G. (2020, May 18). The simple metric that’s taking over big business. Fortune. https://fortune.com/longform/net-promoter-score-fortune-500-customer-satisfaction-metric/
Davis, K. (1977). Human behavior at work: Organizational behavior. New York: McGraw-Hill.
Employee Satisfaction Index – ESI Survey. (n.d.). IP1survey. https://ip1survey.com/esi
Ganesh, K. (2023, May 27). What is an employee engagement score? What does a good score look like? CultureMonkey. https://www.culturemonkey.io/employee-engagement/employee-engagement-score/
Goodey, B. (2022, August 30). Highest NPS scores: Best NPS scores from top companies in 2023. NPS Benchmarks; #creator. https://customergauge.com/benchmarks/blog/top-highest-nps-scores
Grisaffe, D. B. (2007). Questions about the ultimate question: conceptual considerations in evaluating Reichheld’s net promoter score (NPS). The Journal of Consumer Satisfaction, Dissatisfaction and Complaining Behavior, 20, 36-53.
Hamermesh, Daniel. (2001). The Changing Distribution of Job Satisfaction. Journal of Human Resources. 36. 1-30. 10.2307/3069668. Resources,36(1), 1-30.
Jankiraman, P. (2021). Different types of NPS – why and when to use them. Resonate Solutions. https://global.resonate.cx/blog/different-types-of-nps-why-and-when-to-use-them/
Job Descriptive Index. (n.d.). Bowling Green State University. https://www.bgsu.edu/arts-and-sciences/psychology/services/job-descriptive-index.html
Khandelwal, M. (2023, May 26). Types of net promoter score and when to use them. Surveysensum.com. https://www.surveysensum.com/blog/types-of-net-promoter-score/
Kiefer, K. M., Harris-Kojetin, L., Brannon, D., Barry, T., Vasey, J., & Lepore, M. (2005, Mar 31). Measuring long-term care work: A guide to selected instruments to examine direct care worker experiences and outcomes. ASPE. https://aspe.hhs.gov/reports/measuring-long-term-care-work-guide-selected-instruments-examine-direct-care-worker-experiences-1
Kinicki, A. J., McKee-Ryan, F. M., & Schriesheim, C. A. (2002). Assessing the Construct Validity of the Job Descriptive Index: A Review and Meta-Analysis. Researchgate.net. https://www.researchgate.net/publication/11448826_Assessing_the_Construct_Validity_of_the_Job_Descriptive_Index_A_Review_and_Meta-Analysis
Lake, C., Gopalkrishnan, P., Sliter, M., & Withrow, S. (2010). The Job Descriptive Index: Newly updated and available for download. The Industrial-Organizational Psychologist. 48. 47-79.
Le Bras, M. (n.d.). How to calculate eNPS scores for top companies. Engagerocket.Co. Retrieved June 30, 2023, from https://blog.engagerocket.co/calculate-enps-scores-for-top-companies
Leapsome Team. (2023, March 24). ENPS: What Employee Net Promoter Score is & why it matters. Leapsome.com. https://www.leapsome.com/blog/employee-net-promoter-score-enps-what-is-it-why-should-you-measure-it-and-why-does-it-matter
McPherson, J. (2017, February 12). Understanding the employee net promoter score (eNPS). Culture Amp. https://www.cultureamp.com/blog/employee-net-promoter-score
Netigate Marketing. (2014, April 29). How the Employee Satisfaction Index (ESI) works and how to use it. Netigate. https://www.netigate.net/articles/human-resources/how-the-employee-satisfaction-index-esi-works-and-how-to-use-it/
Paulyne. (2022, September 27). How to measure employee satisfaction? 7 tips. Deskbird.com. https://www.deskbird.com/blog/how-to-measure-employee-satisfaction
Ramirez, J. (2023, April 14). A quick guide to calculating the employee engagement score. Erudit.Ai; Erudit. https://www.erudit.ai/blog/how-to-calculate-employee-engagement-score
Reichheld, F. F. (2003). The one number you need to grow. Harvard Business Review, 81(12), 46–54, 124. https://hbr.org/2003/12/the-one-number-you-need-to-grow
Reichheld, F. (2011). The ultimate question 2.0 (revised and expanded edition): How net promoter companies thrive in a customer-driven world. Harvard Business Review Press.
Reichheld, F., Darnell, D., & Burns, M. (2021). Net Promoter 3.0. Harvard Business Review. https://hbr.org/2021/11/net-promoter-3-0
Sedlak, P. (2020). Employee Net Promoter Score (eNPS) as a single-item measure of employee work satisfaction. An empirical evidence from companies operating in Poland. Contemporary Organisation and Management. Challenges and Trends, Michałkiewicz A. and Mierzejewska W.(eds), Wydawnictwo Uniwersytetu Łódzkiego, Łód, 347-357.
Smith, A. (2022). Why employee net promoter score should be employers’ go-to metric. Forbes. https://www.forbes.com/sites/forbesbusinesscouncil/2022/11/14/why-employee-net-promoter-score-should-be-employers-go-to-metric/?sh=5761922825b7
Smith, R. (n.d.). Measuring employee satisfaction. Goodays.Co. Retrieved August 9, 2023, from https://community.goodays.co/en/blog/measuring-employee-satisfaction
Spector, P. (1997). Job Satisfaction: Application, Assessment, Causes, and Consequences. SAGE Publications, Inc.
Staff Reports. (2010). The pros and cons of Net Promoter. Professional Remodeler (Des Plaines, Ill.), 14(2), 18–.
Tasios, T., & Giannouli, V. (2017). Job Descriptive Index (JDI): Reliability and validity study in Greece. American Board of Assessment Psychology, 7(1), 31–61.
Tutuncu, O., & Kozak, M. (2007). An investigation of factors affecting job satisfaction. International Journal of Hospitality & Tourism Administration, 8(1), 1–19. https://doi.org/10.1300/j149v08n01_01
Vélez, Ayuso, A., Perales-González, C., & Rodríguez, J. T. (2020). Churn and Net Promoter Score forecasting for business decision-making through a new stepwise regression methodology. Knowledge-Based Systems, 196, 105762–. https://doi.org/10.1016/j.knosys.2020.105762
Yaneva, M. (2018). Employee satisfaction vs. employee engagement vs. employee NPS. European Journal of Economics and Business Studies, 4(1), 221-227.
YEC. (2023, January 31). NPS and ENPS: Why and how to make measuring count.Forbes. https://www.forbes.com/sites/theyec/2023/01/31/nps-and-enps-why-and-how-to-make-measuring-count/?sh=7ab0ead9b0c1
Appendix 1: The companies 2023 NPS
PDF: NPS Scores for Top Companies (Ranked Highest to Lowest), 2023
Appendix 2: The companies 2022 eNPS
Table 2: Companies 2022 eNPS ((Le Bras, n.d.)